Named after Southern California's Santa Ana Canyon and a fixture of local legend and literature, the Santa Ana is a blustery, dry and warm (often hot) wind that blows out of the desert. In Raymond Chandler's story Red Wind, the title being one of the offshore wind's many nicknames, the Santa Anas were introduced as "those hot dry [winds] that come down through the mountain passes and curl your hair and make your nerves jump and your skin itch. On nights like that every booze party ends in a fight. Meek little wives feel the edge of the carving knife and study their husbands' necks. Anything can happen." Local legends associate the hot, dry winds with homicides and earthquakes, but these are myths. (See note below regarding naming.)
Another popular misconception that the winds are hot owing to their desert origin. Actually, the Santa Anas develop when the desert is relatively cold, and are thus most common during the cool season stretching from October through March. High pressure builds over the Great Basin (e.g., Nevada) and the cold air there begins to sink. However, this air is forced downslope which compresses and warms it at a rate of about 10C per kilometer (29F per mile) of descent. As its temperature rises, the relative humidity drops; the air starts out dry and winds up at sea level much drier still. The air picks up speed as it is channeled through passes and canyons.
Santa Anas can cause a great deal of damage. The fast, hot winds cause vegetation to dry out, increasing the danger of wildfire. Once the fires start, the winds fan the flames and hasten their spread. The winds create turbulence and establish vertical wind shear (in which winds exhibit substantial change in speed and/or direction with height), both posing aviation hazards. The winds tend to make for choppy surf conditions in the Southern California Bight, and often batter the north coast of Santa Catalina Island, including Avalon cove and the island's airport.
This page demonstrates the development of a Santa Ana event in the Los Angeles basin. This simulation was made using the MM5 mesoscale model using initial and boundary information from the NCEP Eta (now called NAM) model. The model, employing three nested domains, having 54, 18 and 6 km resolutions, was started at 12Z (4 AM PST) on November 3rd, 2002, and integrated for 54 hours. A companion page describing the warm season sea and land breeze can be found here.
You may be interested in my The Santa Ana Winds FAQ or a short essay on the "Santa Ana" versus "Santana" naming controversy (Opens in new windows).
|
Commencement of a simulated Santa Ana wind event |
|---|
0Z (4 PM PST): The image below depicts the surface wind and temperature field at 0Z 4 November 2002 (4 PM local time on November 3rd). This is the model's 12 hour forecast for the 18 km resolution domain that extends from Monterey Bay down to northern Baja California. "Surface temperature" is actually the temperature estimated at weather shelter height, about 1.5 m (5 ft). These winds represent the flow at 40 m (130 ft) above the ground; the longest vector represents an 11 m/s (25 mph) wind. The contoured field is terrain elevation, with contour interval 200 m.
At this time, the Mojave desert is cooler than the LA basin and adjacent waters, and the winds are directed southwestward, channeled through the gap in the local mountains. The Santa Ana winds have just gotten started.
That the winds are warm is shown in this next image, which shows the 6 km grid that zooms in on the LA basin. Note that the highest (reddest colored) temperatures over the waters are within the offshore flow. The longest vector represents a 12 m/s (27 mph) wind; these are found in the mountain passes.
The relative dryness of the Santa Ana flow is illustrated below. The colored field is near-surface relative humidity (RH), with blues representing dry air. The downslope flowing Santa Anas are carrying low RH air over the Channel Islands. The winds represent the flow at 700 m (430 ft) above sea level rather than the 40 m winds, and the longest vector is for 15 m/s (34 mph). Comparison of these winds with those shown above suggests that the offshore flow intensifies with height over the ocean. This establishes large vertical wind shear.
|
Subsequent evolution of the offshore flow |
|---|
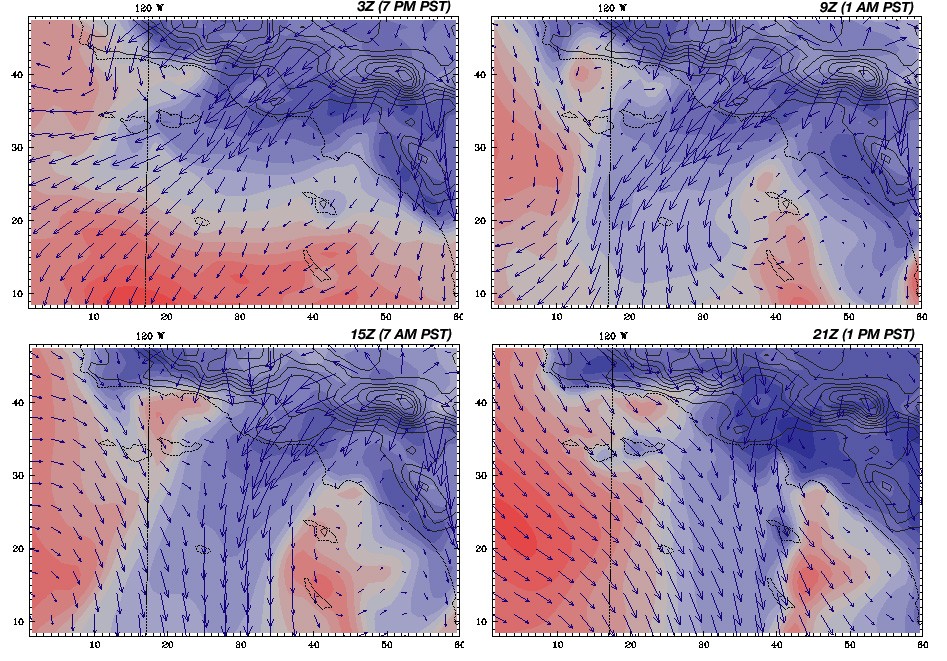
3Z-21Z (7 PM November 3 to 1 PM November 4): The next four panels depict relative humidity and 700 m wind fields every six hours between 7 PM and 1 PM on the next day. The Santa Ana flow strengthens during the nighttime hours as the desert cools even more. After sunrise, however, the sea-breeze reintensifies. This has the result of pushing the Santa Ana winds to the east. By 21Z (1 PM), the offshore flow is northerly and directed towards Catalina Island.
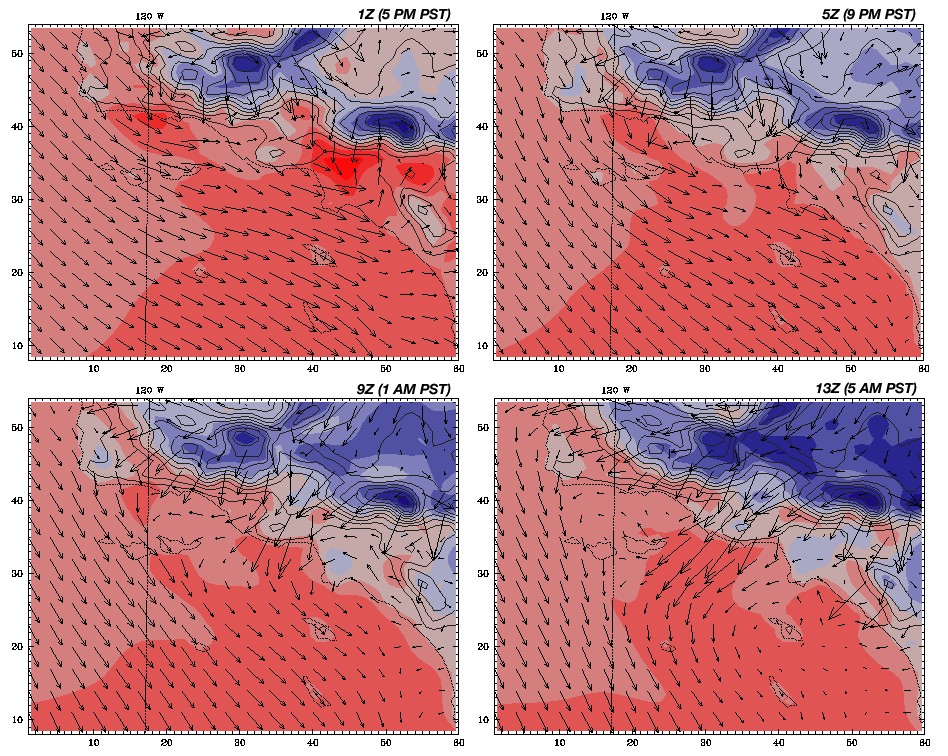
1Z-13Z (5 PM November 4 to 5 AM November 5): Reintensification of the Santa Anas occurs as heating of the land surface decreases, as shown by the surface temperature and 40 m wind fields shown below.
|
Time series and animated plots |
|---|
The plot below is a time series of temperature (in red) and dewpoint (in green) predicted by the model for a fixed location, the UCLA buoy, located in Santa Monica Bay. (Click here to see a basemap showing the buoy's location.) The near-surface winds at this location are also shown. Remember that the wind barbs point to where the wind is coming from.
Note that when the winds are from the north or northwest, the dewpoints are low, indicating the air has relatively little moisture. Abrupt changes in dewpoint accompany wind shifts. Between 12 noon and 1 PM (20-21Z) on 4 November, we can see an upward spike in temperature coinciding with a steep drop in dewpoint. The least diluted core of the offshore winds was pushed past the buoy location by the sea-breeze at that time. Note that this was followed by an extended period of cooling and moistening, carried by the westerly sea-breeze winds.
Animated GIFs for this simulation (These links open up new windows)
New: High resolution animation of relative humidity during October, 2003, event. (2.2 MB GIF). This animation illustrates the highly unsteady, swirling nature of the winds during strong Santa Ana episodes very well.
|
Addendum |
|---|
I get a lot of email from people insisting that the Santa Ana winds are actually the Santana winds, with "Santana" supposedly representing "devil" in Spanish or an Indian language. However, the Spanish word for "devil" is diablo, and Satan is Satanas, conspicuously missing the extra "n" in "Santana". According to this site, a search of Indian languages has failed to support the "Santana" assertion. My research has suggested that the Santa Ana Canyon theory for the wind's name is the most reasonable explanation.
Under any name, however, the Santa Anas are a wind made warmer and drier by compression owing to downslope motion. In other localities, similar winds are called "Foehn" and "Chinook", among other names.
Here is a striking JPL photo of dust carried by Santa Ana winds.
Page created November, 2002, by Robert Fovell, and revised thereafter.