
This page demonstrates the development of the warm season sea and land breezes in the Southern California area centered on Los Angeles. This simulation was made using the MM5 mesoscale model using initial and boundary information from the NCEP Eta model. The model was started at 18Z (11 AM PDT) on June 2nd, 2001, and integrated for 24 hours. The visualizations were made using Dr. Mark Stoelinga's RIP analysis package. Animations were made with GraphicConverter for the Macintosh (some instructions may be found here).
The simulation employs has three nested domains, having 54, 18 and 6 km horizontal resolutions, respectively. Attention is focused on the innermost domain.
|
Index |
|---|
|
Background/reference information (These links open up new windows) |
|---|
|
Ground/sea surface temperature and near surface wind vectors |
|---|
The five images below depict a portion of the model's innermost domain at various times through the simulation period. Wind vectors are plotted every 12 km.
0Z (5 PM PDT, June 2nd): Onshore flow throughout the area; land temperatures still warm (red and brown colors). Note the channeling of the wind through mountain passes and the strong northeast flow over the Santa Monica Bay.
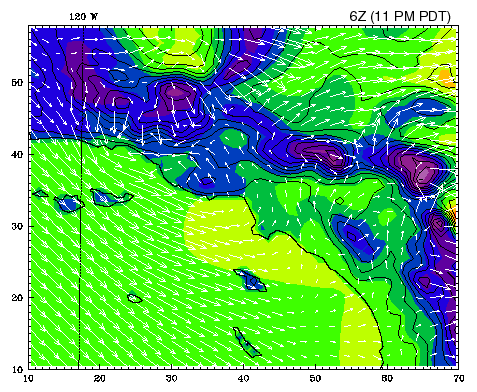
6Z (11 PM PDT): Land area has cooled considerably (turning blue) becoming cooler than the sea surface temperature (which has hardly changed). The wind has started to "back" (becoming southerly) over the LA basin's coastal section. Flow is already offshore over Oxnard plain and in the San Fernando Valley (SFV; see locator map).
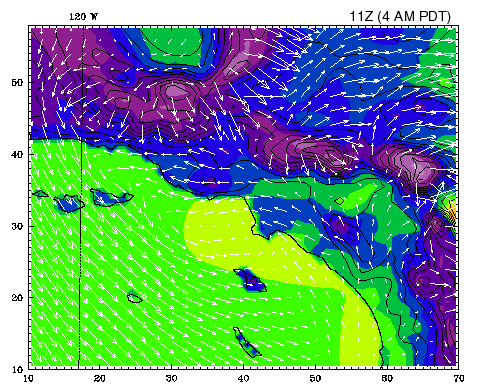
11Z (4 AM PDT, June 3rd): The land breeze has penetrated offshore.
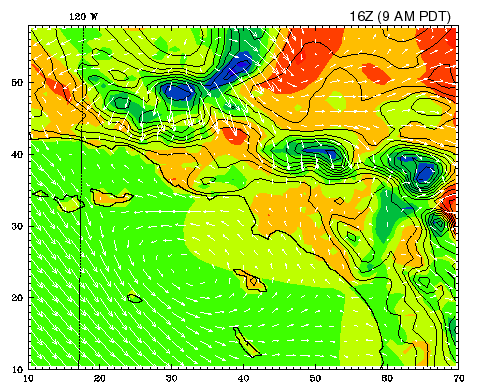
16Z (9 AM PDT): The land breeze reaches maximum offshore extent, but the land itself is already warming again. Note development of the cyclonic circulation over the sea, near Catalina Island.
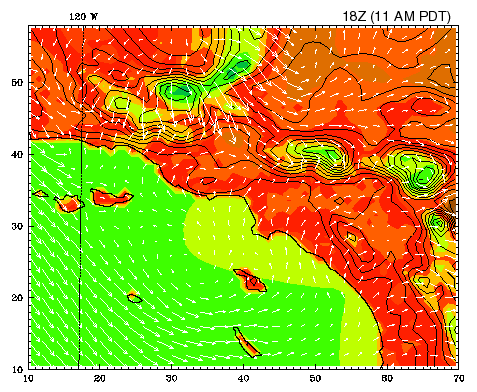
18Z (11 AM PDT): The land breeze disappears as onshore flow is reestablished over the Oxnard plain and in the LA basin. Sea breeze returns to full strength shortly thereafter.
|
Animations of various fields (These links open up new windows) |
|---|
Page created June, 2001, by Robert Fovell