Research Activities
Spatial distributions of ozone precursors and greenhouse gases emissions in the LA-Basin
Observation of the spatial distribution of air pollutant and greenhouse gas concentrations and emission fluxes is a crucial aspect of monitoring air quality as well as the current efforts, mandated by AB32, to curb greenhouse gas emissions in California. To date the strategy to monitor atmospheric trace gases and their emissions on a regional scale has relied upon networks of in-situ ground observations and simple comparison with results from urban air-shed models. The limited number of ground sites in these networks often poses challenges due to possible influence of local emissions and large spatial gaps between the stations. Without complementary data from aircraft, balloons, satellites or other exotic platforms, the ground-based network is inadequate to characterize the emissions of pollutants and greenhouse gases. The quantitative analysis of the observations in models also is often difficult and time consuming. Novel observational and modeling methods are therefore needed to address California’s challenges in regulating and reducing the emission of pollutants and greenhouse gases. In a project led by Jochen Stutz, the first steps are taken towards a future monitoring and air quality monitoring and forecast strategy for pollutants and greenhouse gases by developing and employing a combined observation and modeling system. Optical remote sensing from Mt. Wilson will provide spatial and temporal distributions of the column densities of various pollutants (NO2, HCHO, CO, aerosol extinction by Jochen Stutz, UCLA) and greenhouse gases (CO2, CH4, N2O by Stan Sander, JPL). The observations will be assimilated into the CMAQ model by the UCLA-JPL tropospheric chemistry modeling group (Li) and the adjoint of the model will provide improved emission fluxes and concentrations of NOx, VOC’s, CH4, and N2O in the LA-Basin.
Improving SoCal regional PM predictions through aerosol data assimilation
Determining the manner and extent of global and regional climate change and its societal impacts are grand challenges facing California and the global community. The amplitude and consequences of climate change, particularly on regional and local scales are extremely uncertain. A large part of this uncertainty lies in the fact that important physical processes that are fundamental to obtaining a realistic simulation on regional and smaller scales are not well represented in global models. Coupled regional Earth system models are required to address this climate “downscaling” challenge. One of the largest uncertainties in climate simulation is aerosols, which have complex climate impacts and play a key role in the interaction between climate and the water cycle. Aerosols and consequently surface PM concentrations are also among the largest uncertainties in regional air quality prediction. Thus the challenges of climate change and air quality related to aerosols are intimately coupled. This is particularly true for California - the Greater Los Angeles area remains the most polluted metropolitan region in the U.S. and aerosols are shown to decrease precipitation in California and snowpack in the Sierra-Nevada. Improved simulation of aerosol spatiotemporal distribution and transport are not only central to accurately predict PM air quality in the LA basin but also critical to assessing and predicting California climate change. Integration of satellite remote sensing data with regional Earth system models is a promising new approach for addressing these challenges facing California. In a nascent project led by Yi Chao and founded by JPL, we will develop an aerosol data assimilation capability within the JIFRESSE coupled regional Earth system modeling framework, and to assimilate satellite observations of aerosols for improved simulation of the three-dimensional distribution and transport of aerosols in Southern California. The goal is to improve the prediction of surface PM concentrations in the Greater Los Angeles area and to quantify the export of aerosols from Southern California. The latter focus will be on the transport of black carbon aerosols to the Sierra-Nevada Mountains and the outflow of aerosols to the coastal Pacific marine boundary layer.
Satellite observations of mega-city pollution in East Asia
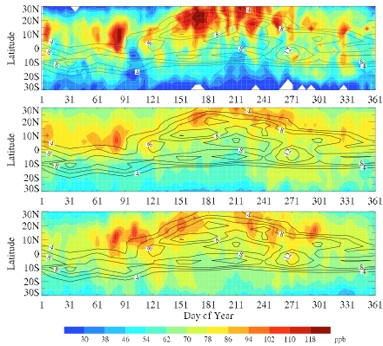
Pollution in East Asia, especially that in mega-cities, has long been the cause for both a regional and global air quality and climate concern. The projected increase in East Asian anthropogenic emissions would only worsen the situation. It is imperative to understand the characteristics of the mega-city pollution. Combining satellite observations and chemical transport modeling is a promising approach to address this need. We analyzed TES (Tropospheric Emission Spectrometer) and OMI (Ozone Measurement Instrument) observations of atmospheric O3, CO, and NO2 over Beijing, Shanghai, Hongkong, Seoul and Tokyo in 2006. We examined the seasonal variations of these pollutants and the controlling processes and interpreted them using a global chemical transport model (GEOS-Chem) simulation. Wind directions and precipitation were also examined to delineate influence from weather conditions. Beijing is the most polluted among the five cities where highs in O3 and CO reached ~200 ppbv and ~400 ppbv respectively in the lower troposphere. The coastal cities, Seoul, Tokyo, and Hong Kong show clear seasonal influence from oceanic air mass in summer. Those mega-cities’ air quality is largely affected by industrial/urban emissions and domestic biofuel burning from China, while the contribution from natural pollution (biomass burning and terrestrial biosphere) are fairly small. The differences in photochemical environment, fossil fuel/biofuel energy uses, and wind direction & precipitation are responsible for the seasonal variation. In particular, the strong summer monsoon over Asia and southerly winds from ocean may cause summertime mitigation of pollutions over the coastal mega-cities in East Asia.
Reference: Shim, C. et al., “Mega-city pollution over East Asia: A satellite perspective”, AGU Fall Meeting, San Francisco, December 2008.
Constraining global NOx emissions through adjoint inversion of SCIAMACHY and OMI NO2 using GEOS-Chem and its adjoint
Atmospheric nitrogen oxide radicals (NOx) play a critical role in tropospheric O3 production. Global NOx emissions especially fossil fuel NOx emissions have been increasing rapidly in developing countries. Bottom-up NOx emission inventories are highly uncertain due to the extrapolation of high spatiotemporal variability of emission fluxes. Additional top-down constraints are necessary to accurately represent the spatial and temporal variations in emissions. Here we explore the use of satellite observations to constrain the global NOx emissions. The GEOS-Chem model and its adjoint are applied for global inversions of SCIAMACHY tropospheric NO2 columns for November 2005. Adjoints were derived for dynamics, emissions, deposition, and gas phase chemistry of the model. The targeted state vector contributing to tropospheric NO2 columns includes NOx emissions from fossil fuel combustions, biomass burning, biofuel burning, soil, and lightning. The issue of model overestimating NOx over the Eastern US and central Europe is improved with significantly lower a posteriori fossil fuel emissions. The a posteriori biomass burning NOx emissions are higher over Siberia and Australia. The a posteriori biofuel burning NOx contributions are lower over Eastern Europe and Asia. The a posteriori NOx emissions are compared with other inventories and the a posteriori dependence on the weightings from background information are investigated. We will expand this approach to examine the seasonal and inter-annual trends of global NOx emissions.
Reference: Shim, C. et al., “Adjoint inversion of SCIAMACHY NO2 to constrain global NOx emissions”, AGU Fall Meeting, San Francisco, December 2007.
The effects of temporal constraints and vertical injection on the transport of biomass burning emissions
Wildfires in Alaska and west Canada represent important sources of aerosols and trace gases in North America. Among the largest uncertainties when modeling wildfire effects are the timing and injection height of biomass burning emissions. Here we simulate CO and aerosols over North America during the 2004 fire season, using the GEOS-Chem chemical transport model. We apply different temporal distributions and injection height profiles to the biomass burning emissions, and compare model results with satellite-, aircraft-, and ground-based measurements. We find that averaged over the fire season, the use of finer temporal resolved biomass emissions usually decreases CO and aerosol concentrations near the fire source region, and often enhances long-range transport. Among the individual temporal constraints, switching from monthly to 8-day time intervals for emissions has the largest effect on CO and aerosol distributions, and shows better agreement with measured day-to-day variability. Injection height substantially modifies the surface concentration and vertical profiles of pollutants near the source region. The simulation of black carbon aerosol is more sensitive to the temporal and injection height distribution of biomass burning emissions. The use of MISR-derived injection heights improves agreement with surface aerosol concentration near the fire source. Our results indicate that the discrepancies between model simulations and MOPITT CO measurements near the Hudson Bay can not be attributed solely to the representation of injection height within the model. Frequent occurrence of strong convection in North America during summer tends to limit the influence of injection height distribution of fire emissions in Alaska and Canada on aerosol and gas distributions over eastern North America.
Reference:
Chen, Y., Q. B. Li, J. T. Randerson, E. A. Lyons, R. A. Kahn, D. L. Nelson, and D. J. Diner, The sensitivity of CO and aerosol transport to the temporal and veritcal distribution of North American boreal fire emissions, J. Geophys. Res., submitted, 2008.
Mazzoni, D., J. A. Logan, D. Diner, R. Kahn, L. Tong, and Q. B. Li, A data-mining approach to cataloging smoke plumes from MISR and MODIS data, Remote Sensing of Environment, 107, 138-148, 2007. [Full text (pdf)]
Inter-hemispheric transport of pollution from a satellite perspective
Reference:
Cai, C., Q. B. Li, B. Latner, and N. Livesey, A satellite perspective on the inter-hemispheric transport of carbon monoxide, J. Geophys. Res., submitted, 2008. [Full text (pdf)]

Reference:
Shim, C., Q. B. Li, M. Luo, S. Kulawik, H. Worden, J. Worden, A. Eldering, M. Avery, G. Diskin, G. Sachse, A. Weinheimer, D. Knapp, D. Montzca, and T. Campos, Satellite observations of Mexico City pollution outflow from the Tropospheric Emissions Spectrometer (TES), Atmos. Environ., doi:10.1016/j.atmosenv.2008.11.026, in press, 2008. [Full text (pdf)]
Reference:
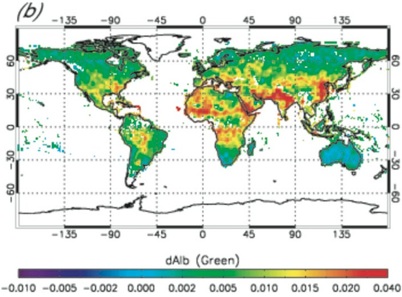
Chen, Y., Q. B. Li, R. A. Kahn, J. T. Randerson, and D. Diner, Quantifying aerosol direct radiative effect with MISR observations: I. TOA albedo change by aerosols based on land surface types, J. Geophys. Res., doi:10.1029/2008JD010754, in press, 2008. [Full text (pdf)]
Long-range transport of aerosols to the northern polar region and its impact on snow albedo
What is the relative importance of different source types/regions on black carbon concentrations in northern polar region and how the influx of black carbon impacts snow/ice albedo in the Arctic? Our proposed study will quantify from where and how much black carbon aerosols are transported to the northern high-latitudes and to what extent changes in the Arctic snow/ice albedo are due to the deposited black carbon.
This study is led by Postdoc Sunita Verma, in close collaboration with Rokjin Park of Harvard University and Daven Henze of Caltech.
Intercontinental transport of pollution in the upper troposphere constrained by MLS observations
Tans-Pacific transport of Asian pollution has received considerable attention because of its global air quality and climate implications. It has been difficult to investigate long-range transport of pollution in the upper troposphere because of the lack of suitable observations. The launch of Aura-MLS, with its measurements of upper tropospheric carbon monoxide (CO) and ozone among other species, makes it possible for the first time to systematically examine long-range transport in the upper troposphere. In this study we present an analysis of the first two years (September 2004-September 2006) of Aura-MLS upper tropospheric observations of CO and ozone, in conjunction with a global 3-D chemical transport model (GEOS-CHEM), with a focus to (1) quantify the temporal variability (i.e., frequency and strength) of trans-Pacific transport of Asian pollution in the upper troposphere, to (2) delineate transport events in the upper troposphere from the ones in the middle and lower troposphere by combining and contrasting MLS and MOPITT observations of CO, and to (3) examine the preferred meteorological conditions and associated processes including warm conveyor belt (WCB) that are responsible for these upper troposphere trans-Pacific transport.
This study is led by Nathaniel Livesey of the MLS team.
Reference: Livesey, N., Q.B. Li, R. Fuller, Quantifying trans-Pacific transport of Asian pollution in the upper troposphere with Aura-MLS observations, AGU Fall Meeting, 2006.
Interpreting MLS Tropical Upper Tropospheric Ozone Observations with GEOS-Chem
What are the factors controlling the distribution of tropical upper tropospheric ozone? Our focus is on better understanding the processes controlling the seasonal and interannual variability of tropical upper tropospheric ozone, including biomass burning, deep convection, and long-range transport. We interpret the distribution of tropical upper tropospheric ozone from MLS by using the GEOS-Chem model and additional information from in situ observations.
This study is led by Postdoc Chenxia Cai, in close collaboration with the MLS team.
References:
Jiang, X., M. T. Chahine, E. T. Olsen, Q. B. Li, L. Chen, and Y. L. Yung, A study of polar stratosphere-troposphere exchange using AIRS CO2 and O3, J. Atmos. Sci., submitted, 2008. [Full text (pdf)]
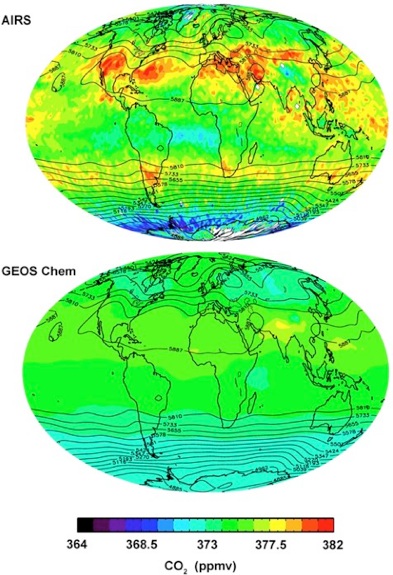
Jiang, X. Q. B. Li, M.-C. Liang, R.-L. Shia, M. T. Chahine, E. T. Olsen, L. L. Chen, J. T. Randerson, and Y. L. Yung, Simulation of upper tropospheric CO2 from chemistry and transport models, Global Biogeochemical Cycles, doi:10.1029/2007GB003049, in press, 2008. [Full text (pdf)]
Chahine, M., L. Chen, P. Dimotakis, X. Jiang, Q. B. Li, E. Olsen, T. Pagano, J. Randerson, and Y. Yung, Satellite remote sounding of middle tropospheric CO2, Geophys. Res. Lett., 35, L17807, doi:10.1029/2008GL035022, 2008. [Full text (pdf)]
Reference:
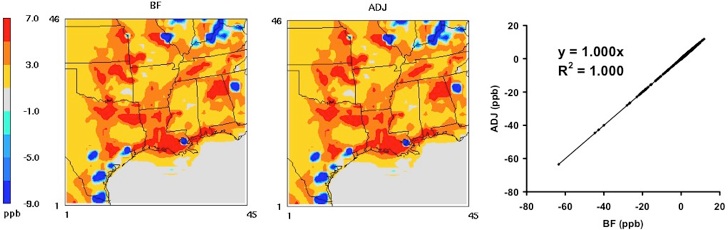
Hakami, A., D. K. Henze, J. H. Seinfeld, K. Singh, A. Sandu, S. Kim, D. Byun, and Q. B. Li, The adjoint of CMAQ, Environ. Sci. & Tech., 42(22), 7807-7817, 10.1021/es070944p, 2007. [Full text (pdf)]
Tropical Atlantic tropospheric ozone observed by TES during Nothern Africa biomass burning season

Reference:
Jourdain, L., H. M. Worden, J. R. Worden, K. Bowman, Q. B. Li, A. Eldering, S. S. Kulawik, G. Osterman, F. Boersma, B. Fisher, C. P. Rinsland, R. Beer, and M. Gunson, Tropospheric vertical distribution of tropical Atlantic ozone observed by TES during the Northern African biomass burning season, Geophys. Res. Lett., 34, L04810, doi:10.1029/2006GL028284, 2007. [Full text (pdf)]
Reference:
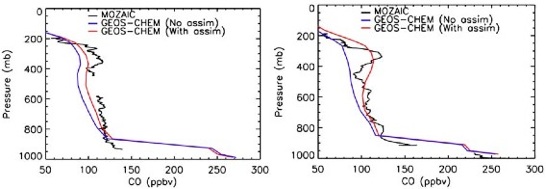
Nigel A.D. Richards, Qinbin Li, Kevin W. Bowman, John Worden, Susan Sund-Kulawik, Helen Worden, Michael. Lampel, Jean-Francois Lamarque, and Boris V. Khattatov, Assimilation of TES CO into a global CTM: First results, A.C.P.D, 2006.
Reference:
Filipiak, M.J., R.S. Harwood, J. H. Jiang, Q. B. Li, N.J. Livesey, G. L. Manney, W. G. Read, M. J. Schwartz, J. W. Waters, and D. L. Wu, Carbon monoxide measured by the EOS Microwave Limb Sounder on Aura: First results, Geophys. Res. Lett., 32, L14825,doi:10.1029/2005GL022765, 2005. [Full text (pdf)]
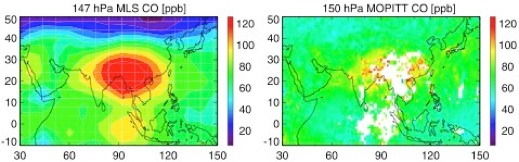
Li, Q. B., J. H. Jiang, D. L. Wu, W. G. Read, N. J. Livesey, J. W. Waters,Y. S. Zhang, B. Wang, M. J. Filipiak, C. P. Davis, S. Turquety, S. L. Wu, R. J. Park, R. M. Yantosca, and D. J. Jacob, Convective outflow of South Asian pollution: A global CTM simulation compared with Aura MLS observations, Geophys. Res. Lett., 32, L14826, doi:10.1029/2005GL022762, 2005.
Reference:
Li, Q. B., D. J. Jacob, R. Park, Y. X. Wang, C. L. Heald, R. Hudman, R. M. Yantosca, R. V. Martin, and M. J. Evans, Outflow Pathways for North American Pollution in Summer: A Global 3-D Model Analysis of MODIS and MOPITT Observations, J. Geophys. Res., submitted, 2004. [Full Text (pdf)]
Export efficiency for NOy from continental boundary layer
Fossil fuel combustion accounts for > 50% of the global atmospheric emission of NOx, but this source is concentrated in the polluted continental boundary layer (CBL) and only a small fraction is exported to the global troposphere. Better quantification is needed of the export efficiency of NOy (NOx and its oxidation products) out of the CBL. A recent Lagrangian analysis of the NOy-CO correlations observed from aircraft in the North Atlantic Regional Experiment (September 1997, NARE'97) downwind of eastern North America indicated a NOy export efficiency of < 10%, with < 10% of the exported NOy present as NOx. However, previous 3-D model Eulerian budget analyses for the North American boundary layer indicated NOy export efficiencies of 25-30% with 30-35% of the exported NOy present as NOx. We investigated this apparent discrepancy by simulating the NARE'97 aircraft observations with a global 3-D model of tropospheric chemistry (GEOS-CHEM) and using the model to calculate the NOy export efficiency both through a Lagrangian analysis of the NOy-CO correlations along the aircraft flight tracks and through a Eulerian budget analysis for the North American boundary layer. The model reproduces the variability and NOy-CO correlations observed in the aircraft data and also at the Harvard Forest surface site in the northeastern United States. We show that the previous Lagrangian analyses of the NOy export efficiency during NARE'97 were probably biased low due to underestimate of the CO background. Correcting for this bias we find a NOy export efficiency of 17±7% in the model and 15±11% in the observations. A similar NOy export efficiency (20%) in the model is obtained from the Eulerian budget analysis, demonstrating that the Lagrangian and Eulerian approaches are in fact consistent. Export efficiencies of NOy in previous 3-D model Eulerian budget analyses were probably too high because of insufficient scavenging out of the CBL. Model results indicate that only 6% of the exported NOy is present as NOx along the aircraft flight tracks, in agreement with the observations, but that 40% of the NOy export flux is as NOx,in agreement with the previous 3-D model analyses. This result reflects the fast oxidation of NOx during transport downwind of North America. The eventual ozone production in the global troposphere due to the exported NOx and PAN, with equal contributions from each, is estimated to be comparable to the direct export of ozone pollution from the North American boundary layer.
Reference:
Li, Q.B., D. J. Jacob, D. D. Parrish, and J. W. Munger, Export of NOy from the North American boundary layer: Reconciling aircraft observations and global model budgets, J. Geophys. Res., 109, D02313, 10.1029/2003JD004086, 2004. [Full Text (pdf)]
Atmospheric budgets for biomass burning tracers HCN and CH3CN
We construct global atmospheric budgets of HCN and CH3CN through a 3-D simulation of the HCN-CH3CN-CO system constrained and evaluated with aircraft observations from the TRACE-P mission over the NW Pacific in February-April 2001. Observed background vertical gradients of HCN and CH3CN imply a dominant ocean sink for both gases, with deposition velocity of 0.13 cm s-1 for both and saturation ratios of 0.79 for HCN and 0.88 for CH3CN. Observations for both gases in the free troposphere implied a dominant source from biomass burning. Enhancement of HCN observed in Chinese urban plumes is attributed tentatively to residential coal burning. Biomass burning and residential coal burning emission ratios relative to CO of 0.27% and 1.6% respectively for HCN, and of 0.20% and 0.25% respectively for CH3CN, are consistent with observations in biomass burning and Chinese urban plumes, and provide the best fit in the model for simulation of observed TRACE-P vertical profiles, HCN-CH3CN-CO correlations, as well as long-term records of HCN columns and CH3CN observations over the northern Indian Ocean. Biomass burning and residential coal burning contribute 0.63 and 0.2 Tg N yr-1 respectively to global HCN and 0.47 and 0.03 Tg N yr-1 respectively to CH3CN. Ocean uptake is the dominant sink for both gases, with oxidation by OH representing an additional minor sink. The resulting tropospheric lifetimes are 5.3 months for HCN and 5.8 months for CH3CN. The model predicts very low HCN and CH3CN concentrations at high southern latitudes, reflecting the assumption of uniform saturation ratio; observations in that region are needed. In the free troposphere, the dominance of biomass burning sources (70-85% for HCN and 90-95% for CH3CN) implies that both gases can be used as biomass burning tracers. More work is needed to identify the urban source apparent in the Chinese plume observations.
Reference:
Li, Q.B., D. J. Jacob, R. M. Yantosca, C. L. Heald, H. B. Singh, M. Koike, Y. Zhao, G. W. Sachse, and D. G. Streets, A Global 3-D Model Evaluation of the Atmospheric Budgets of HCN and CH3CN: Constraints From Aircraft Measurements Over the Western Pacific, J. Geophys. Res., 108(D21), 8827, doi:10.1029/2002JD003075, 2003. [Full Text (pdf)]
Springtime ozone maximum at northern midlatitudes: Origin of ozone at Bermuda
Conflicting interpretations of the spring ozone maximum observed at Bermuda (32°N, 65°W) have fueled the debate on stratospheric influence versus tropospheric production as sources of tropospheric ozone. In this study we use the GEOS-CHEM global 3-D model of tropospheric ozone-NOx-hydrocarbon chemistry driven by assimilated meteorological observations to reconcile these past interpretations. The model reproduces the observed seasonal cycle of surface ozone at Bermuda and captures the springtime day-to-day variability (r = 0.82, n = 122, p < 0.001) driven by high-ozone events. We find that boundary layer transport of North American pollution behind cold fronts is the principal contributor to springtime surface ozone at Bermuda and is responsible for all the high-ozone events. The model reproduces the observed positive correlations of surface ozone with 7Be and 210Pb at Bermuda; the correlation with 7Be reflects the strong subsidence behind cold fronts, resulting in the mixing of middle-tropospheric air with continental boundary layer outflow in the air arriving at Bermuda, as indicated by the positive 7Be-210Pb correlation. This mixing appears to have been an obfuscating factor in past interpretations of subsiding back-trajectories at Bermuda as evidence for a stratospheric or upper-tropospheric origin for ozone. Isentropic back-trajectories computed in our model reproduce the previously reported subsidence associated with high-ozone events. Even in the free troposphere we find that the stratosphere contributes less than 5 ppbv (< 10%) to spring ozone over Bermuda. Positive O3-7Be and negative O3-210Pb correlations observed at Tenerife (28°N, 16°W, 2.4 km) in summer are reproduced by the model and are consistent with a middle-tropospheric source of ozone, not an upper-tropospheric or stratospheric source as previously suggested. A regional budget for the North Atlantic in spring indicates that the stratosphere contributes less than 10 ppbv ozone (< 5%) below 500 hPa, while the lower troposphere contributes 20-40 ppbv ozone throughout the troposphere.
Reference:
Li, Q.B., D.J. Jacob, T.D. Fairlie, H. Liu, R.M. Yantosca, and R.V. Martin, Stratospheric versus pollution influences on ozone at Bermuda: Reconciling past analyses, J. Geophys. Res., 107(D22), 4611, doi: 10.1029/2002JD002138, 2002. [Full Text (pdf)]
Trans-Atlantic transport of pollution and implications for air quality
We examine the transatlantic transport of anthropogenic ozone and its impact on surface ozone in Europe and North America by using a 5-year (1993-1997) simulation with the GEOS-CHEM global 3-D model of tropospheric chemistry. Long-term time series of ozone and CO at Mace Head (Ireland), Sable Island (Canada), and Westman Island (Iceland) are used to evaluate transatlantic transport in the model. North American anthropogenic emissions contribute on average 5 ppbv to surface ozone at Mace Head, and up to 10-20 ppbv during transatlantic transport events which are forerunners of broader events in Europe. These events are associated with low-level westerly flow driven by an intense Icelandic low between Iceland and the British Isles. North American influence on ozone at Mace Head is strongly correlated with the North Atlantic Oscillation (NAO), implying that the NAO index can be used to forecast transatlantic transport of North American pollution to Europe. European anthropogenic emissions contribute on average less than 2 ppbv to surface ozone at Sable Island but up to 5-10 ppbv during transatlantic transport events. These events are associated with low-level easterly flow established by anomalous low pressure at 45°N over the North Atlantic. North American anthropogenic emissions enhance surface ozone in continental Europe by 2-4 ppbv on average in summer, and by 5-10 ppbv during transatlantic transport events; transport in the boundary layer and subsidence from the free troposphere are both important mechanisms. We find in the model that 20% of the violations of the European Council ozone standard (55 ppbv, 8-hour average) in the summer of 1997 over Europe would not have occurred in the absence of anthropogenic emissions from North America. North American influence on surface ozone in Europe is particularly strong at the thresholds used for the European standards (55-65 ppbv).
Reference:
Li, Q.B., D. J. Jacob, I. Bey, P. I. Palmer, B. N. Duncan, B. D. Field, R. V. Martin, A. M. Fiore, R. M. Yantosca, D. D. Parrish, P. G. Simmonds, and S. J. Oltmans, Transatlantic transport of pollution and its effects on surface ozone in Europe and North America, J. Geophys. Res., 107(0), 10.1029/2001JD001422, 2002. [Full Text (pdf)]
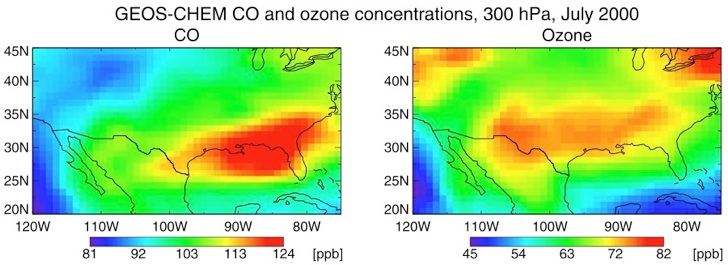
An ozone maximum in the middle troposphere over the Middle East
The GEOS-CHEM global 3-D model of tropospheric chemistry driven by assimilated meteorological observations predicts a pronounced summertime ozone maximum over the Middle East, with mean mixing ratios in the middle and upper troposphere in excess of 80 ppbv. This model feature is consistent with the few observations in the region from commercial aircraft. We investigated the factors that lead to the maximum in the model with tagged ozone tracer simulation and sensitivity simulations. Its origin in the model reflects a complex interplay of dynamical and chemical factors, and of anthropogenic and natural influences. The anticyclonic circulation in the middle and upper troposphere over the Middle East funnels northern midlatitudes pollution transported in the westerly subtropical jet as well as lightning outflow from the Indian monsoon and pollution from eastern Asia transported in an easterly tropical jet. Strong large-scale subsidence over the region takes place with continued net production of ozone and little mid-level outflow. Transport from the stratosphere does not contribute significantly to the ozone maximum. Sensitivity simulations with anthropogenic or lightning emissions omitted indicate maximum effects on ozone over the Middle East with decreases of 25-30% and 10-15% respectively in the tropospheric ozone column. More observations in this region are needed to confirm the presence of the ozone maximum, which is of interest both as a test of our understanding of tropospheric ozone chemistry and because of its implications for anthropogenic climate forcing.
Reference:
Li, Q.B., D. J. Jacob, J. A. Logan, I. Bey, R. M. Yantosca, H. Liu, R. V. Martin, A. M. Fiore, B. D. Field, B. N. Duncan, and V. Thouret, A tropospheric ozone maximum over the Middle East, Geophys. Res. Lett., 28, 3235-3238, 2001. [Full Text (ps)]
Atmospheric budget for HCN: Biomass burning source, ocean sink?
The observed seasonal amplitude of atmospheric HCN concentrations measured in tropical regions and at northern midlatitudes implies an atmospheric lifetime of a few months for HCN, much shorter than is commonly assumed from oxidation by OH (a few years). We propose that ocean uptake may provide the missing sink, and show with the global 3-D model simulation that the observations of atmospheric HCN can be roughly reproduced in a scenario where biomass burning provides the main source (1.4-2.9 Tg N yr-1) and ocean uptake provides the main sink (HCN atmospheric lifetime of 2-4 months). Such a budget would imply that HCN is a sensitive tracer of biomass burning on large scales, of particular value because of it is readily observed from space. The ocean sink hypothesis can be tested with measurements of HCN concentrations in marine air and seawater.
Reference:
Li, Q.B., D.J. Jacob, I. Bey, R.M. Yantosca, Y. Zhao, and Y. Kondo, Atmospheric hydrogen cyanide (HCN): Biomass burning source, ocean sink?, Geophys. Res. Lett., 27, 357-360, 2000. [Full Text (pdf)]