 | ||||||||||||||||
|

Global Climate Assessing the sensitivity of top-of-the-atmosphere
albedo on snow and sea ice On a climatological global-mean basis, a large portion of upwelling solar photons at
the top-of-atmosphere are reflected by the atmosphere rather than the
surface. This is also largely true even in cryosphere regions, where the
surface is highly reflective of solar radiation. This dominance
of the atmosphere stems from two effects: First, incoming solar
photons at the-top-of-atmosphere are partially absorbed and reflected back
to space by the atmosphere, reducing the number of photons reaching the
surface; Second, solar photons initially reflected by the surface are partially
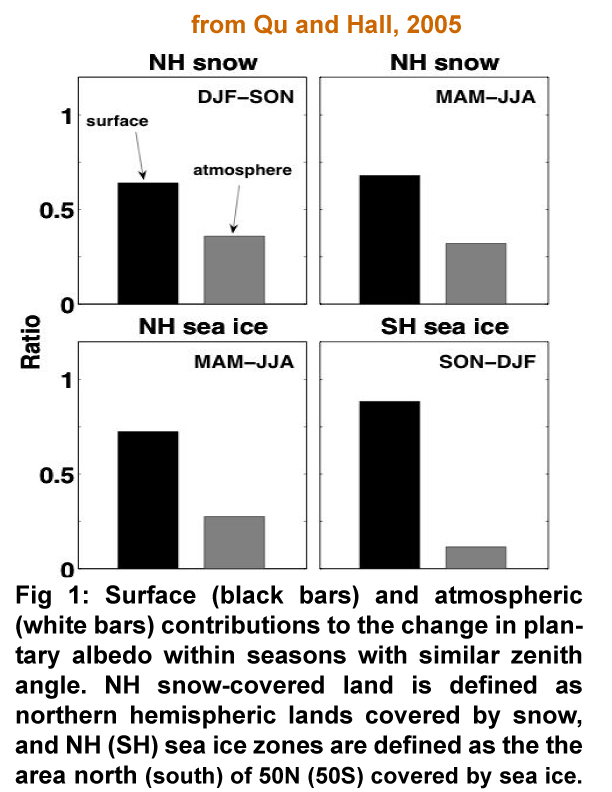
absorbed and reflected back to the surface by the atmosphere, In contrast to the climatological case, the surface dominates the variability in planetary albedo on seasonal and interannual time scales (see Figs. 1 and 2). The surface accounts for about 75% of the change in climatological planetary albedo from one season to another with similar zenith angle and more than 50% of its interannual variability at nearly all times of year, especially during seasons with extensive snow and sea ice extent. These results may have important implications for future climate change.
Satellites have observed a retreat of NH snow cover and Arctic sea ice associated with
a large-scale warming in the NH. Note that ISCCP flux data set is used to contruct Figs 1 and 2. download the publication describing these results in more detail. |
|||||||||||||||


