Southern
California Bight Ocean Modeling Projects at CESR, UCLA
last
modified: June 18, 2010
APPROACH
The
regional oceanic responses in the Southern California Bight to the
large-scale current system such as California Current, global remote
forcing through the coastal wave guide alongshore, local and remote
forcing (atmospheric forcing, tides and waves), local complexity in
the topography and coastline, and intrinsic variabilities associated
with mesoscale to submesoscale transition, have been investigated
with comprehensive modeling frameworks. The key component to pursue
this is the Regional Oceanic Modelling System (ROMS, Schepetkin and
McWilliams, 2005; 2008) that is a horizontal curvilinear and vertical
terrain-following coordinate, hydrostatic, incompressible, Boussinesq
approximation, free-surface oceanic circulation model with
non-conservative forcing, vertical and lateral diffusion, and bottom
drag. It makes a baroclinic-barotropic mode split, with explicit fast
time-stepping and subsequent conservative averaging of barotropic
variables. Tremendous effort has been made to expand ROMS'
capabilities to include non-hydrostatic dynamics (kanarska et al.,
2007), surface gravity waves (Uchiyama et al., 2010), fundamental
sediment transport dynamics (Blaas et al., 2007) and so on. The
large-scale influences are taken into account through a nesting
technique where multiple model domains are configured to
realistically determine significant oceanic signals in many different
scales. The actual nested model designs depends on what dynamics you
would like to detect, and thus varies from project to project. One
example being used for “Submesoscale dynamics” project is as
follows.
The
ROMS configuration consists of triply nested model domains with an
off-line, one-way nesting technique that downscale from 5 km
horizontal resolution of the United States west coast (L0), to 1 km
resolution of the SCB (L1), to 250 m horizontal resolution of the
Santa Monica and San Pedro Shelves (L2). Each domain has 40 bottom
topography following levels vertically stretched such that grid cell
refinement occurs near the surface and bottom. The
model topographies are given by the 30-second global SRTM30
bathymetry (Becker et al., 2008: Marine
Geodesy)
in general, whereas the 3-second NOAA-NGDC coastal relief data set
(http://www.ngdc.noaa.gov/mgg/coastal/crm.html)
is used for the near-shore regions depending on data availability.
The outer-most L0 is forced by the monthly-averaged SODA version
2.0.4, a POP-based assimilated global oceanic dataset (e.g. Carton et
al., 1996: J.
Geophys. Res.)
as lateral boundary conditions, a monthly-averaged QuikSCAT-ECMWF
blended wind data
(http://cersat.ifremer.fr/data/discovery/by_product_type/gridded_products/mwf_blended)
as a surface momentum stress, a monthly-average AVHRR pathfinder
satellite SST
(http://podaac.jpl.nasa.gov/DATA_PRODUCT/SST/index.html)
and the COADS climatological dataset
(http://www.ncdc.noaa.gov/oa/climate/coads/)
for the other surface fluxes. On L0, the monthly climatology of
runoff from major rivers (Dai and Trenberth, 2002: J.
Hydrometeorol.)
is taken into account. The intermediate L1 and the inner-most L2 are
then driven by the corresponding parent ROMS model solutions with
daily (L0 to L1) and 2-hourly (L1 to L2) lateral boundary update. All
the surface boundary conditions for L1 and L2 are give by an hourly
atmospheric forcing by a double-nested WRF model (e.g., Michalakes et
al., 1998: In: Design
of a next-generation regional weather research and forecast model :
Towards Teracomputing,
World Scientific) on 18- and 6-km horizontal grid spacings; the 6-km
solution is used to force the ROMS L1 and L2 models with a one-way
coupling approach. Tides are included in L1 and L2 with TPXO 7.1
global tidal prediction (e.g., Egbert et al., 1994: J.
Geophys. Res.)
to force L1 at the lateral boundaries with ten tidal major
constituents (M2, S2, N2, K2, K1, O1, P1, Q1, Mf, and Mm) that
synthetically provide free-surface elevation and barotropic velocity
components at every barotropic time step by superposing on to the
daily-averaged boundary conditions from the L0 run. Intrinsic
three-dimensional tidal variabilities in L1 are then brought into the
L2 run through the high-frequency, 2-hourly boundary update. For
more details on the model configurations, one may wish to refer our
journal articles, most of which are indicated at the end of each
project descriptions.
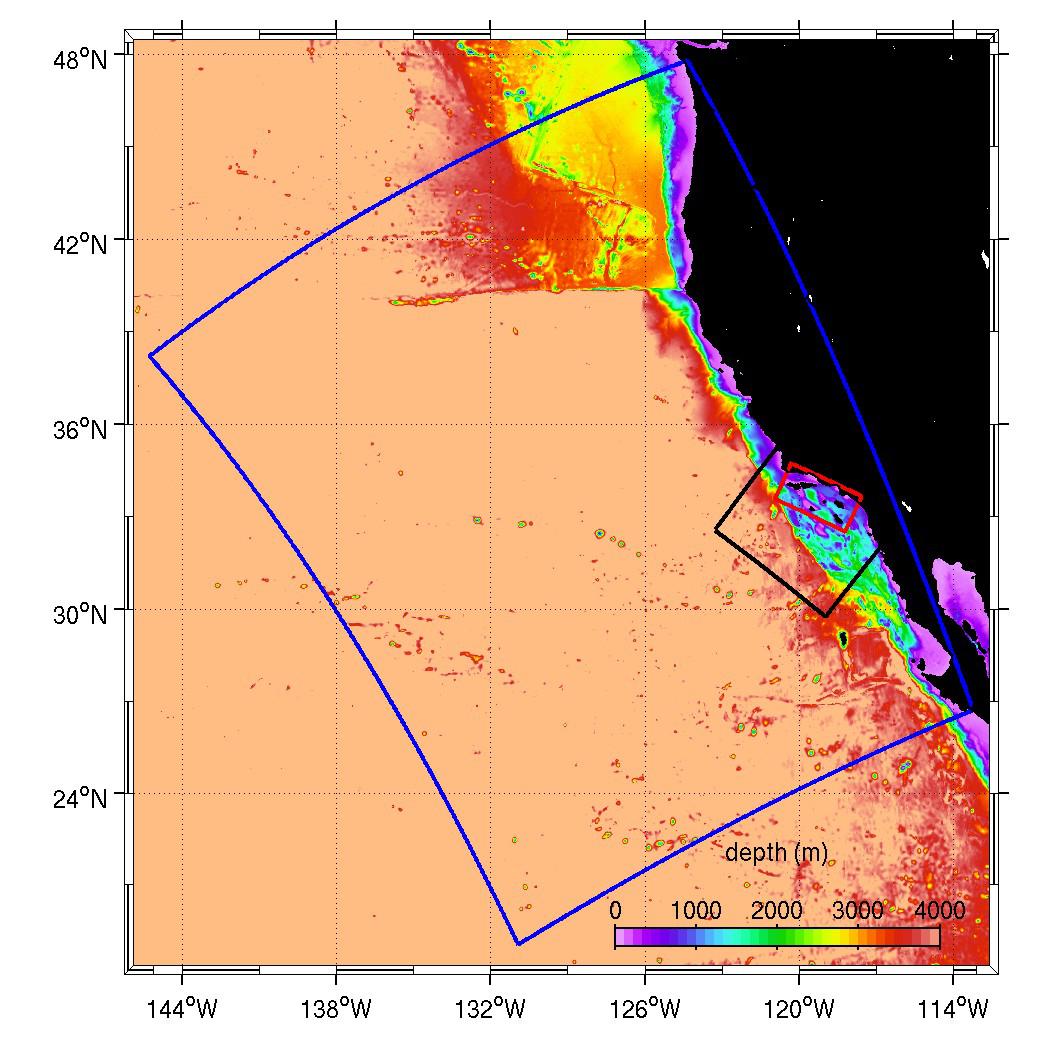
An
example of nested grid configurations used for the SCB projects. The
figure shows bathrmetry along the U.S. West Coast and perimeters of
triple nested ROMS model domains (a descendant
of
the ICC configuration used for “submesoscale dynamics” project).
Blue box is the outer most L0 domain with a 5-km horizontal grid
spacing, laterally forced by the SODA global data, black box: the
intermediate L1 domain with a 1-km resolution downscaled from ROMS
L0, and red box: the inner-most L2 domain with a 250-m resolution
nested in ROMS L1.
Related
publication
A.
F. Shchepetkin and J. C. McWilliams (2005), The Regional Oceanic
Modeling System: A split-explicit, free-surface,
topography-following-coordinate oceanic model, Ocean
Modeling,
9,
347-404.
Y.
Kanarska and A. F. Shchepetkin and J. C. McWilliams (2007):
Algorithm for non-hydrostatic dynamics in the Regional Oceanic
Modeling System, Ocean Modelling, 18, 143-174.
A.
F. Shchepetkin and J. C. McWilliams (2008): Computational kernel
algorithms for fine-scale, multiprocess, longtime oceanic
simulations, In: Handbook of Numerical Analysis: Computational
Methods for the Ocean and the Atmosphere, Eds: R. Temam and J. Tri
PROJECTS
1.
Multi-year, multi-scale oceanic variabilities in SCB
The
oceanic circulation in the Southern California Bight (SCB) is
influenced by the large-scale California Current offshore, tropical
remote forcing through the coastal wave guide alongshore, and local
atmospheric forcing. The region is characterized by local complexity
in the topography and coastline. All these factors engender
variability in the circulation on interannual, seasonal, and
intraseasonal time scales. This study applies the Regional Oceanic
Modeling System (ROMS) to the SCB circulation and its multiple-scale
variability. The model is configured in three levels of nested grids
with the parent grid covering the whole US West Coast. The first
child grid covers a large southern domain, and the third grid zooms
in on the SCB region. The three horizontal grid resolutions are 20
km, 6.7 km, and 1 km, respectively. The external forcings are
momentum, heat, and freshwater flux at the surface and adaptive
nudging to gyre-scale SODA reanalysis fields at the boundaries. The
momentum flux is from a three-hourly reanalysis mesoscale MM5 wind
with a 6 km resolution for the finest grid in the SCB. The oceanic
model starts in an equilibrium state from a multiple-year cyclical
climatology run, and then it is integrated from years 1996 through
2003. In this paper, the 8-year simulation at the 1 km resolution is
analyzed and assessed against extensive observational data:
High-Frequency (HF) radar data, current meters, Acoustic Doppler
Current Profilers (ADCP) data, hydrographic measurements, tide
gauges, drifters, altimeters, and radiometers. The simulation shows
that the domain-scale surface circulation in the SCB is characterized
by the Southern California Cyclonic Gyre, comprised of the offshore
equatorward California Current System and the onshore poleward
Southern California Countercurrent. The simulation also exhibits
three subdomainscale, persistent (i.e., standing), cyclonic eddies
related to the local topography and wind forcing: the Santa Barbara
Channel Eddy, the Central-SCB Eddy, and the Catalina-Clemente Eddy.
Comparisons with observational data reveal that ROMS reproduces a
realistic mean state of the SCB oceanic circulation, as well as its
interannual (mainly as a local manifestation of an ENSO event),
seasonal, and intraseasonal (eddy-scale) variations. We find high
correlations of the wind curl with both the alongshore pressure
gradient (APG) and the eddy kinetic energy level in their variations
on time scales of seasons and longer. The geostrophic currents are
much stronger than the wind-driven Ekman flows at the surface. The
model exhibits intrinsic eddy variability with strong topographically
related heterogeneity, westward-propagating Rossby waves, and
poleward-propagating coastally-trapped waves (albeit with smaller
amplitude than observed due to missing high-frequency variations in
the southern boundary conditions).
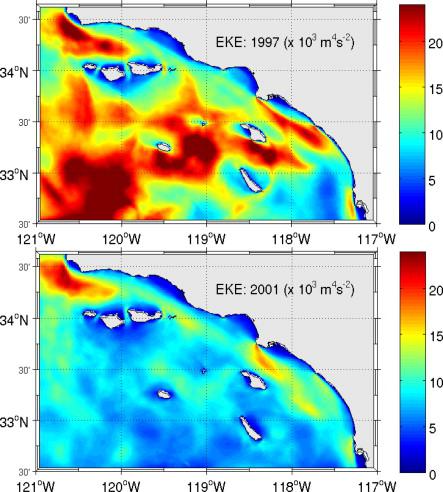
Maps
of the annual-mean surface EKE during the years with the largest and
smallest eddy energy: 1997 (top) and 2001 (bottom). The largest EKE
occurs during in 1997 in association with the ENSO event, and the
lowest EKE occurs in 2001, with the 1997 level almost double that in
2001. The largest changes in the EKE pattern are in the offshore
central SCB and further offshore in the California Current.
Related
publication
2.
Submesoscale dynamics in eddying flow regimes
In
computational simulations of an idealized subtropical eastern
boundary upwelling current system, similar to the California Current,
a submesoscale transition occurs in the eddy variability as the
horizontal grid scale is reduced to O (1) km. The transition
in terms of the emergent flow structure and the associated
time-averaged eddy fluxes has been examined with ROMS. In addition to
the mesoscale eddies that arise from a primary instability of the
alongshore, wind-driven currents, significant energy is transferred
into submesoscale fronts and vortices in the upper ocean. The
submesoscale arises through surface frontogenesis growing off
upwelled cold filaments that are pulled offshore and strained in
between the mesoscale eddy centers. In turn, some submesoscale fronts
become unstable and develop submesoscale meanders and fragment into
roll-up vortices. Associated with this phenomenon are a large
vertical vorticity and Rossby number, a large vertical velocity,
relatively flat horizontal spectra (contrary to the prevailing view
of mesoscale dynamics), a large vertical buoyancy flux acting to
restratify the upper ocean, a submesoscale energy conversion from
potential to kinetic, a significant spatial and temporal
intermittency in the upper ocean, and material exchanges between the
surface boundary layer and pycnocline. Comparison with available
observations indicates that submesoscale fronts and instabilities
occur widely in the upper ocean, with characteristics similar to the
simulations.
The
emergent upper-ocean submesoscale fronts are analyzed from
phenomenological and dynamical perspectives, using a combination of
composite averaging and separation of distinctive subregions of the
flow. The initiating dynamical process for the transition is
near-surface frontogenesis. The frontal behavior is similar to both
observed meteorological surface fronts and solutions of the
approximate dynamical model called surface dynamics (i.e., uniform
interior potential vorticity q and diagnostic force balance)
in the intensification of surface density gradients and secondary
circulations in response to a mesoscale strain field. However, there
are significant behavioral differences compared to the
surface-dynamics model. Wind stress acts on fronts through nonlinear
Ekman transport and creation and destruction of potential vorticity.
The strain-induced frontogenesis is disrupted by vigorous
submesoscale frontal instabilities that in turn lead to secondary
frontogenesis events, submesoscale vortices, and excitation of even
smaller-scale flows. Intermittent, submesoscale breakdown of
geostrophic and gradient-wind force balance occurs during the intense
frontogenesis and frontal-instability events.
The
mesoscale to submesoscale transition is mainly explained by the
emergence of ubiquitous submesoscale density fronts and ageostrophic
circulations about them in the weakly stratified surface boundary
layer. Here the high-resolution simulations are further analyzed from
the perspective of the kinetic energy (KE) spectrum shape and
spectral energy fluxes in the mesoscale-to-submesoscale range in the
upper ocean. For wavenumbers greater than the mesoscale energy peak,
there is a submesoscale power-law regime in the spectrum with an
exponent close to −2. In the KE balance an important conversion
from potential to kinetic energy takes place at all wavenumbers in
both mesoscale and submesoscale ranges; this conversion is the
energetic counterpart of the vertical restratification flux and
frontogenesis discussed in the earlier papers. A significant forward
cascade of KE occurs in the submesoscale range en route to
dissipation at even smaller scales. This is contrary to the inverse
energy cascade of geostrophic turbulence and it is, in fact,
fundamentally associated with the horizontally divergent (i.e.,
ageostrophic) velocity component. The submesoscale dynamical
processes of frontogenesis, frontal instability, and breakdown of
diagnostic force balance are all essential elements of the energy
cycle of potential energy conversion and forward KE cascade.
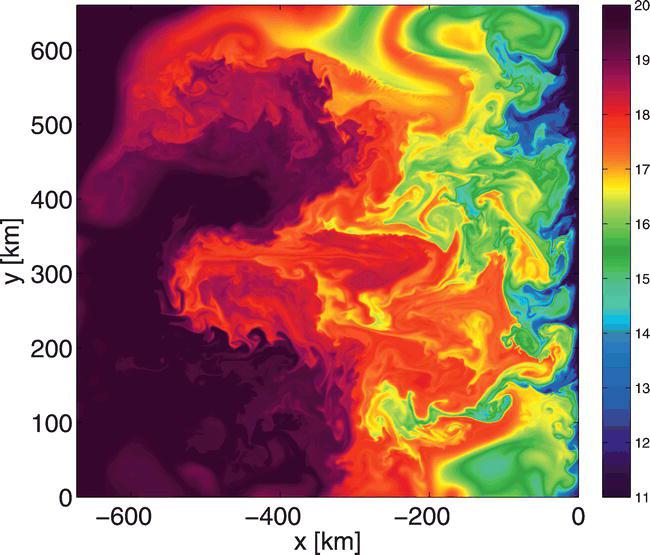
Instantaneous
surface temperature T (x, y) field at time t
= 208 days after ICC initialization, as an example of a suite of
computational simulations for an idealized subtropical, eastern
boundary, upwelling current system [referred to as the idealized
California Current (ICC)]. Note the string of meanders and filaments
in 17°–19°C water with wavelengths ≈50 km running along the
edges of the offshore eddies. Notice that an instability event is
located at (x ≈ –250 km, y ≈ 350 km); it
separates waters in the range 16°–18°C, and the temperature front
is roughly aligned with the x axis.
Related
publication
X.
Capet, J. C. McWilliams, M. J. Molemaker, and A. F. Shchepetkin
(2008a): Mesoscale to submesoscale transition in the California
Current System. Part I: Flow structure, eddy flux, and observational
tests. J.
Phys. Oceanogr.,
38,
29–43.
X.
Capet, J. C. McWilliams, M. J. Molemaker, and A. Shchepetkin
(2008b): Mesoscale to submesoscale transition in the California
Current System. Part II: Frontal processes. J.
Phys. Oceanogr.,
38,
44–64.
X.
Capet, J. C. McWilliams, M. J. Molemaker, A. F. Shchepetkin.
(2008c): Mesoscale to Submesoscale Transition in the California
Current System. Part III: Energy Balance and Flux. Journal
of Physical Oceanography
38,
2256-2269.
3.
Wave-driven currents and their effects on SCB circulations
A
vortex-force formalism for the interaction of surface gravity waves
and currents is implemented in a three-dimensional (3D),
terrain-following, hydrostatic, oceanic circulation model [Regional
Oceanic Modeling System: ROMS; Schepetkin and McWilliams, 2005].
Eulerian wave-averaged current equations for mass, momentum, and
tracers are included in ROMS based on an asymptotic theory by
(McWilliams et al., 2004) plus non-conservative wave effects due to
wave breaking, associated surface roller waves, bottom streaming, and
wave-enhanced vertical mixing and bottom drag especially for coastal
and nearshore applications. The currents are coupled with a
spectrum-peak WKB wave-refraction model that includes the effect of
currents on waves, or, alternatively, a spectrum-resolving wave model
(e.g., SWAN) is used. The coupled system is applied to the nearshore
surf zone during the DUCK94 field measurement campaign. Model results
are compared to the observations and effects of parameter choices are
investigated with emphasis on simulating and interpreting the
vertical profiles for alongshore and cross-shore currents. The model
is further compared to another ROMS-based 3D coupled model by (Warner
et al., 2008) with depth-dependent radiation stresses on a plane
beach. In both tests the present model manifests an onshore surface
flow and compensating offshore near-bed undertow near the shoreline
and around the breaking point. In contrast, the radiation-stress
prescription yields significantly weaker vertical shear. The
currents' cross-shore and vertical structure is significantly shaped
by the wave effects of near-surface breaker acceleration, vertical
component of vortex force, and wave-enhanced pressure force and
bottom drag.
Conservative
wave effects on inner-shelf circulation are investigated in the
Channel Island region off Santa Barbara, California (referred to as
SBC) using a quadruple nested ROMS configuration bounded by the
global SODA field, downscaled from the Pacific basin at 12.5 km and
to a half km grid resolution for Southern California Bight. In
addition to the synoptic forcing and tides, idealized moderate waves
( uniform in space and time) are imposed. Diagnosis is made for one
spring-neap cycle in September 2006. This is a case where radiation
stress does not work well as for uniform wave field leading to no
radiation stress divergence. The SBC summer thermocline is known to
be shallow, around only 10-20 m, whereas waves increase it by about 8
m, and overall the mixed-layer depth is deepened about 15 % by
wave-induced upper-current modification and associated enhancement of
vertical shear. A clockwise-rotating, anti-cyclone sits in the middle
of SBC, while prominent strengthening and modulation of such a
circulation occurs mainly due to Stokes-Coriolis effects in upper
ocean associated with waves. The upper-ocean averaged velocity
magnitude and angle are also modified by waves substantially: the
magnitude is increased by about 30 %, and the direction is rotated
clockwise by about 6 degree. The Stokes-Ekman layer is much deeper
than the mixed layer depth and reaches at about 60 m deep. Vortex
force also plays a crucial role in modifying the circulation through
eddy modulation. The surface subtidal eddy kinetic energy (EKE) has
the maxima in the channel due to poleward advection of submesoscale
eddies, accentuated by waves by about 20 %, partially attributed to
change in mean advection of eddies associated with Stokes-Coriolis
force. In turn, a vortical Rossby number (relative vertical vorticity
over the background rotation), giving a ratio of mean vortex force to
mean Stokes-Coriolis force, suggests the VF contribution reaches 60 %
of the Stoke-Coriolis contribution where EKE is high. Moreover, VF is
predominant in the nearshore area that is a central arena for eddy
shedding: hance eddy-wave interaction by vortex force is crucial in
modulating eddies, that could lead to feedback to the main
circulation through Reynolds stress divergence.
Wave
impact on upper-ocean turbulent kinetic energy (EKE) field in the SBC
(Santa Barbara Channel, CA). Upper panel: subtital EKE in the SBC
with wave effects (EKEwec), lower panel: EKE difference,
EKEwec - EKEnw, where EKEnw is the
one omitting wave effects. The surface subtidal EKE (upper panel) has
the maxima in the channel due to poleward advection of submesoscale
eddies, accentuated by waves by about 20 % (lower panel), partially
attributed to change in mean advection of eddies associated with
Stokes-Coriolis force. In turn, a vortical Rossby number (relative
vertical vorticity over the background rotation), giving a ratio of
mean vortex force to mean Stokes-Coriolis force, suggests the VF
contribution reaches 60 % of the Stoke-Coriolis contribution where
EKE is high.
Related
publication
J.
C. McWilliams, J. M. Restrepo and E. M. Lane (2004): An asymptotic
theory for the interaction of waves and currents in coastal waters,
Journal
of Fluid Mechanics,
511,
135-178, doi:10.1017/S0022112004009358.
Y.
Uchiyama, J. C. McWilliams, and J. M. Restrepo (2009), Wave-current
interaction in nearshore shear instability analyzed with a vortex
force formalism, J.
Geophys. Res.,
114, C06021, doi:10.1029/2008JC005135.
Y.
Uchiyama, J. C. McWilliams and A. F. Shchepetkin (2010):
Wave–current interaction in an oceanic circulation model with a
vortex-force formalism: Application to the surf zone, Ocean
Modelling,
34,
16-35, doi:10.1016/j.ocemod.2010.04.002.
4.
Generation and propagation of internal tides in SCB
To
be added...
5.
Island-induced wakes and their impact on circulation
With
the existence of eight substantial islands in the Southern California
Bight, the oceanic circulation is significantly affected by island
wakes. In this paper a high-resolution numerical model (on a 1km
grid), forced by a high-resolution wind (2 km), is used to study the
wakes. Island wakes arise due both to currents moving past islands
and to wind wakes that force lee currents in response. A comparison
between simulations with and without islands shows the surface
enstrophy (i.e., area-integrated square of the vertical component of
vorticity at the surface) decreases substantially when the islands in
the oceanic model are removed, and the enstrophy decrease mainly
takes place in the areas around the islands. Three cases of wake
formation and evolution are analyzed for the Channel Islands, San
Nicolas Island, and Santa Catalina Island. When flows squeeze through
gaps between the Channel Islands, current shears arise, and the
bottom drag makes a significant contribution to the vorticity
generation. Downstream the vorticity rolls up into submesoscale
eddies. When the California Current passes San Nicolas Island from
the northwest, a relatively strong flow forms over the shelf break on
the northeastern coast and gives rise to a locally large bottom
stress that generates anticyclonic vorticity, while on the
southwestern side, with an adverse flow pushing the main wake current
away from the island, positive vorticity has been generated and a
cyclonic eddy detaches into the wake. When the northward Southern
California Countercurrent passes the irregular shape of Santa
Catalina Island, cyclonic eddies form on the southeastern coast of
the island, due primarily to lateral stress rather than bottom
stress; they remain coherent as they detach and propagate downstream,
and thus they are plausible candidates for the submesoscale ‘‘spirals
on the sea’’ seen in many satellite images. Finally, the oceanic
response to wind wakes is analyzed in a spin-up experiment with a
time-invariant wind that exhibits strips of both positive and
negative curl in the island lee. Corresponding vorticity strips in
the ocean develop through the mechanism of Ekman pumping.
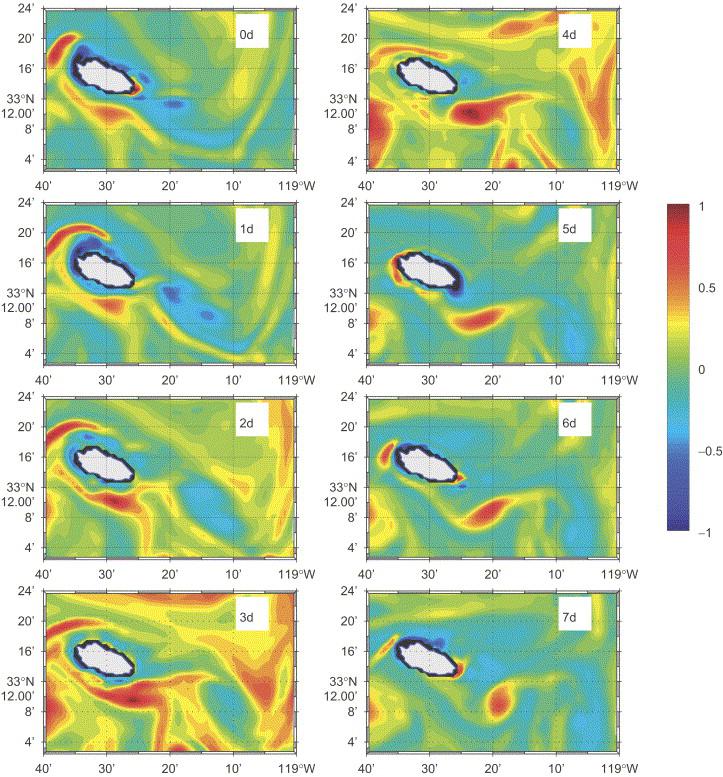
San
Nicolas Island wake: sequence of normalized surface vorticity maps
from March 21–28, 2002. March 21=day
0.
When current passes San Nicolas Island from the northwest, an island
wake forms. A time series of 8 days for the surface vorticity is
plotted, showing the formation and detachment of a cyclonic eddy and
the decaying progression of an anticyclonic eddy in the wake. While
the cyclonic eddy remains coherent, the anticyclonic eddy becomes
weaker and weaker as it is advected downstream. Asymmetry in the
robustness of cyclonic and anticyclonic wake eddies can be due to the
weakening effect of centrifugal instability on the latter when ζ
is
smaller than -f
,
as occasionally occurs in the figure.
Related
publication
6.
Sediments and material dispersal in SCB
Suspended
sediment-transport processes in Santa Monica and San Pedro Bay are
analyzed using the sediment-transport capabilities of the Regional
Oceanic Modeling System (ROMS). A one-month simulation for December
2001 has been carried out with a set of nested domains. The model
inputs include tides, winds, surface waves, and idealized initial
sediment conditions for sand and non-cohesive silt. Apart from the
control run, the sensitivity of the results to surface waves, ripple
roughness and bed armoring has been analyzed. From the control
experiment, the horizontal transport of sand turns out to be limited
to within a few km of the nearshore erosion zones. During high wave
events, silt is transported over further distances and also partly
offshelf in distinct plumes. The effectiveness of horizontal silt
transport depends strongly on vertical mixing due to both surface
wind stress and wave-enhanced bottom stress. High wave events
coincident with strong winds (hence strong vertical mixing) are the
most optimal conditions for sediment-transport. Excluding wave
effects in the simulation shows that surface waves are the dominant
factor in resuspending bed material on the Southern Californian
shelves. The sensitivity experiments also show that the direct
influence of additional ripple roughness on erosion and deposition is
relatively weak. Switching off bed armoring locally results in
increases of near-bottom concentrations by a factor of 20 for silt
and a factor of 5 for sand as well as stronger spatial gradients in
grain size.
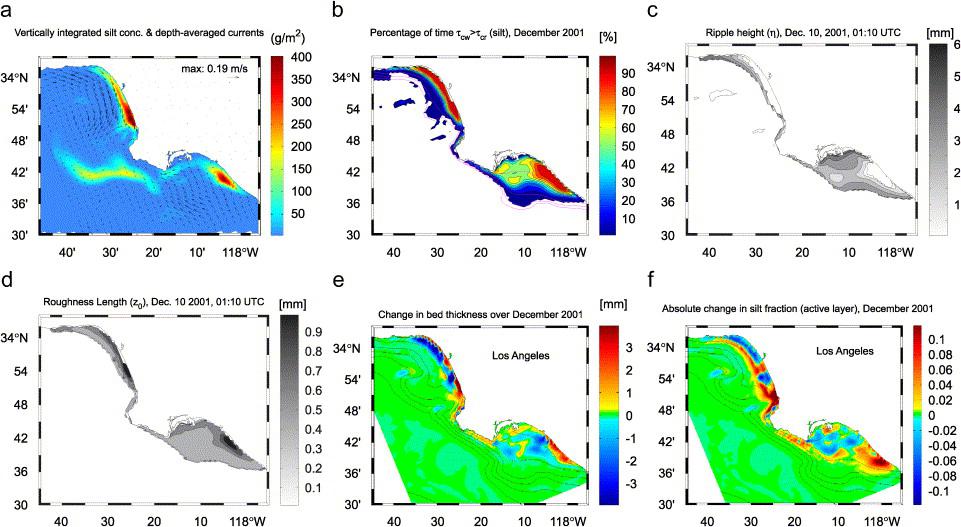
(a)
Depth-averaged, tide-averaged velocity and vertically integrated silt
concentration, half a day after maximum of December 15 wave event.
Concentrations locally up to 500 g/m2.
(b) Fraction of time that wave–current bottom stress exceeds the
threshold for silt suspension, i.e., τcw>τcr,silt.
Dotted lines: 20–65 m isobaths (15 m interval). (c) Ripple height
(η)
at the peak of 10 December wave event. (d) Bed roughness (including
ripple roughness and bed-load roughness) at the peak of 10 December
wave event. (e) Net change in bed thickness over December 2001
control experiment. Red: net deposition; blue: net erosion. Color
range -4
to
4 mm, data range -28
to
11 mm (extremes just off Redondo Beach). Also shown are 15, 30, 60,
120, 240, 480 m isobaths. (f) As (e) but for net change in silt
fraction of the active layer. Color range: -0.12
to
0.12, data range: -0.12
to
0.39 (extremes in nearshore areas).
Related
publication
RESOURCES
National
Center for Supercomputing Applications
University
of California Shared Research Computing Services
PEOPLE
James
McWilliams
Yusuke
Uchiyama
Maarten
Buijsman
Jeroen
Molemaker
Changming
Dong
Alexander
Shchepetkin
Copyright
©
University of California, Los
Angeles, Dept. Atmospheric and Ocean Sciences, Center for Earth
System Research. All rights reserved.