
Animated GIF made by Robert Fovell.
From NOAA satellite imagery.

Animated GIF made by Robert Fovell.
Simulation employed the DTDM model and GrADS.

Animated GIF made by Robert Fovell.
Simulation employed the MM5 model and Vis5D.
|
Information regarding "Meteorology: An Introduction to the Wonders of the Weather" by Robert Fovell |
|---|
I created the course entitled Meteorology: An Introduction to the Wonders of the Weather, which was published by The Great Courses (formerly "The Teaching Company") in February, 2010. This course provides a rigorous (although almost entirely non-mathematical) treatment of weather suitable for nonmajors in the "lower division" (i.e., freshmen and sophomores). Although the course does not employ mathematics, it does rely on physics and physical intuition, and requires attention and dedication. This is a university-level course in meteorology, emphasizing concepts rather than facts. Making this course was one of the most interesting and beneficial challenges in my life.
Anticipating that some viewers might appreciate the opportunity for a more leisurely inspection, I offer below some movies employed in "Meteorology". These are animations that I made, using numerical models or other freely available online sources. You are free to use any of the images or animations below, but an acknowledgment or link-back is appreciated. Click on the images to spawn animations in new windows.
Movies created by others that I used with permission are also linked below. Please report broken and dead links to me.
I also have a page in which I try to answer some questions that have been raised by viewers.
|
Lecture 1 |
|---|
|
|
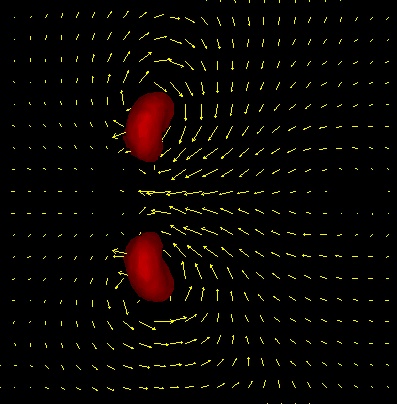
Water vapor satellite imagery showing shear instability. Animated GIF made by Robert Fovell. From NOAA satellite imagery. |
|
|
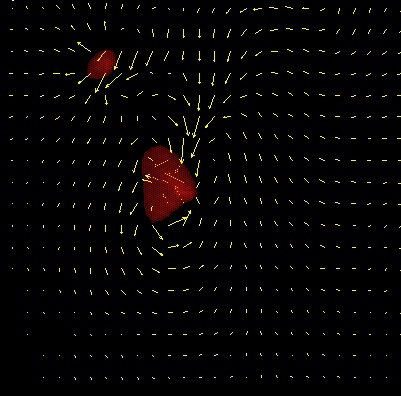
Kelvin-Helmholtz instability. Animated GIF made by Robert Fovell. Simulation employed the DTDM model and GrADS. |
|
|
The "Perfect Storm". Animated GIF made by Robert Fovell. Simulation employed the MM5 model and Vis5D. |
|
Lecture 3 |
|---|
Ozone hole maps and movies. (External link.)
|
Lecture 6 |
|---|
 |
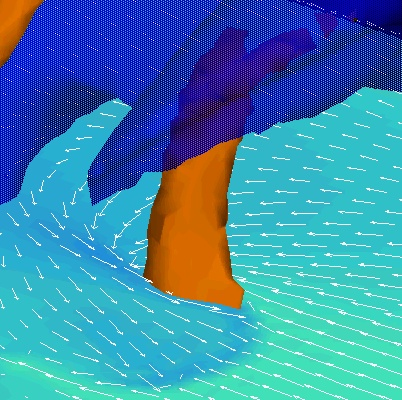
Simulation of the Santa Ana winds. Animated GIF made by Robert Fovell. Simulation employed the MM5 model and Vis5D. |
|
Lecture 9 |
|---|
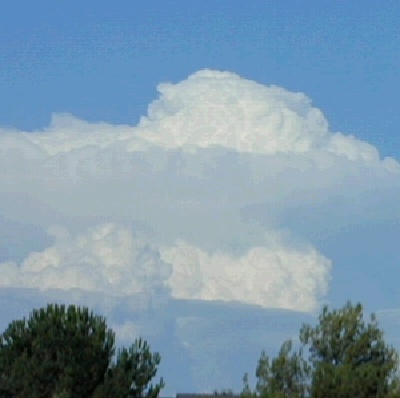 |
A movie of a multicellular thunderstorm. QuickTime movie from digital camera stills taken by Robert Fovell. Requires QuickTime. |
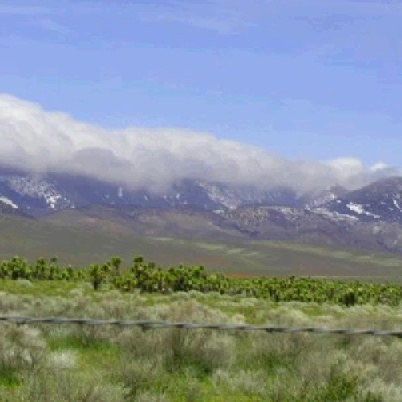 |
Mojave cloud movie. QuickTime movie from digital camera stills taken by Robert Fovell. Requires QuickTime. |
|
Lecture 10 |
|---|
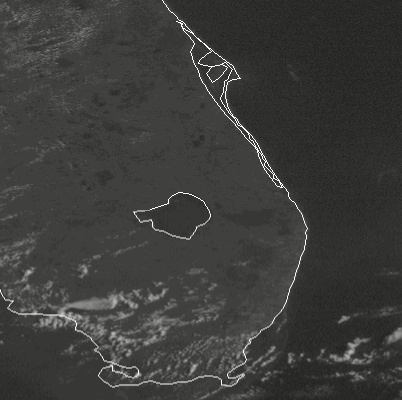 |
NOAA visible satellite imagery centered on South Florida. QuickTime movie made by Robert Fovell from archived imagery. Requires QuickTime. |
 |
Roll development movie (not shown during lecture). Animated GIF made by Robert Fovell. Simulation employed the ARPS model and GrADS. |
|
Lecture 15 |
|---|
 |
500 mb map sequence for December, 2007. Animated GIF made by Robert Fovell. From data provided by NOAA. |
|
Lecture 18 |
|---|
 |
Radar imagery from Lincoln, NE, NEXRAD radar for 8 July 2003. Animated GIF made by Robert Fovell. From data provided by NOAA. |
 |
Radar imagery from Laughlin Air Force Base, TX, NEXRAD radar for 9 May 2009. Animated GIF made by Robert Fovell. From data provided by NOAA. |
 |
Radar imagery for 2-3 April 2006. Animated GIF made by Robert Fovell. From data provided by NOAA. |
|
Lecture 19 |
|---|
 |
Radar imagery for 23-24 April 2003. Animated GIF made by Robert Fovell. From data provided by NOAA. |
 |
Radar imagery from Lubbock, TX, NEXRAD radar for 9 May 2006. Animated GIF made by Robert Fovell. From data provided by NOAA. |
 |
Animation of a supercell thunderstorm: cloud outline. Animated GIF made by Robert Fovell. Simulation employed the ARPS model and Vis5D. |
 |
Animation of a supercell thunderstorm: response to straight hodograph. Movie by Robert Fovell. Requires QuickTime. Simulation employed the ARPS model and Vis5D. |
 |
Animation of a supercell thunderstorm: response to curved hodograph. Movie by Robert Fovell. Requires QuickTime. Simulation employed the ARPS model and Vis5D. |
 |
Animation of a supercell thunderstorm: intense updraft outline. Animated GIF by Robert Fovell. Simulation employed the ARPS model and Vis5D. |
 |
Animation of a supercell thunderstorm: tornado-lile vortex. Movie by Robert Fovell. Requires QuickTime. Simulation employed the ARPS model and Vis5D. |
|
Lecture 20 |
|---|
 |
Animation of average monthly sea surface temperature (SST). Animated GIF by Robert Fovell. From data provided by NOAA. |
NASA animations of El Nino using radar altimetry. (External link.)
|
Lecture 21 |
|---|
 |
Radar imagery from Lake Charles, LA, NEXRAD radar of Hurricane Rita (2005). Animated GIF by Robert Fovell. From data provided by NOAA. |
 |
Simulation of hurricane development. Animated GIF by Robert Fovell. Simulation employed a customized version of the WRF model and GrADS. |
 |
Animation of average monthly sea surface temperature (SST) exceeding 27C. Animated GIF by Robert Fovell. From data provided by NOAA. |
Tropical cyclone track maps from NOAA.
|
Lecture 23 |
|---|
 |
Time series from the Lorenz model. Animated GIF. Coded by Robert Fovell. |