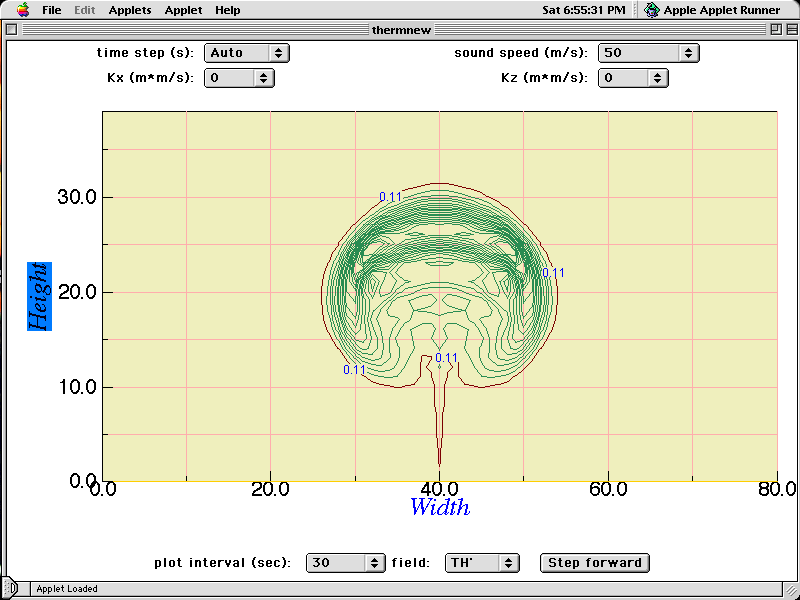
Four selectable menus are arrayed across the top. These values must be set before hitting the "Step forward" button for the first time. To change these values after running the model, you will need to reload the applet. The menus control:
- Time step Choices: Auto (default), 1, 2 or 3 seconds. The value of the "Auto" selection depends on the sound wave speed selected by the user (see below). A 1 second time step makes the model run very slowly. The 3 second time step, however, violates the linear stability limit (for sound speeds above 33.33 m/s); this is useful for watching the model "blow up". The model will cease responding to the "Step forward" button before all hell breaks loose, however. :-)
- Sound speed Choices: 50 (default), 33.33, or 100 m/s. The model design includes the speed of sound as a free parameter (see below). The slower the sound speed (relative to its actual value of about 350 m/s), the more the error. The faster the speed, however, the more slowly the model runs.
- Kx Choices: 0 (default) or 20 square meters per second. Horizontal diffusion applied to smooth the model fields.
- Kz Choices: 0 (default) or 20 square meters per second. Vertical diffusion applied to smooth the model fields.
Below the plot area are two additional selectable menus:
- Plot interval Choices: 30 (default), 60, or 120 seconds. Clicking "Step forward" integrates the model for this time interval; a plot is displayed upon conclusion.
- Field
- TH'-- Temperature perturbation field (actually potential temperature), in Kelvin;
- PI'-- Pressure perturbation field, nondimensional in this model;
- U-- Horizontal velocity field, in meters per second;
- W-- Vertical velocity field, in meters per second.
You can change the plot interval or field viewed at any time. These plots are made using Leigh Brookshaw's contour graphing classes. Unfortunately, negative contours are not specially marked.
Some rudimentary information regarding model integration statistics are printed to the Java Console as the model runs. To access the Java Console in Netscape Communicator, see the "Communicator" or "Communicator > Tools" menus, depending on the program version. Each time step, the model reports the domain maximum values of each of the four prognostic variables.
Click here to start the model
Clicking on the link opens a new window.
What you see
When you start the applet, the initial perturbation temperature field is
displayed. This shows a bubble of warm air (a "thermal") that subsequently rises
relative to its surroundings. The thermal's positive buoyancy creates
rising motion within it and sinking motion on its flanks. The bubble
initially
induces high (low) perturbation pressure above (below) the bubble's
center, which itself provokes divergence above (convergence below) the
thermal. As the integration proceeds, the temperature field starts
evincing a "mushroom" shape (see picture above). If run long enough,
the thermal slams into
the model's rigid upper top.
About the model
This is a brutally simple numerical model, being used as a demonstration
device. The numerical method is a very simple one: the second-order
leapfrog time/center space scheme. The lateral boundaries are periodic;
the upper and lower boundaries are rigid plates. Computational
diffusion is handled via a second-order term with constant coefficients
that are selected by the user.
Handling of sound waves
In this "quasi-compressible" model, the speed of sound (normally about 350
meters per second) is treated as a free parameter. The sound wave is
typically the fastest moving signal in the model, and its speed limits the
time step that may be stably employed. In this model, the default sound
speed is specified as 50 meters per second, which is far to small
to produce a truly physically valid solution. However, it allows the model
to use larger time steps, and thus runs more quickly.
Platform/browser-dependent weirdness
This applet exhibits different strange characteristics in different
browsers and platforms. In Netscape 4.0x on the Mac, for example, the
plot's background color may not be repainted after the initial plot. Also,
contour labels may not appear. In
the
Solaris version of Netscape, the grid labelings may not show up. Also with
Netscape Solaris, you may have to pass the cursor over the grey window to
get the first plot to show. Etc.,
etc..
Page created January 1999, by Robert Fovell
Updated March 1999 and November 2001